How we built a telemetry system for a macOS dictation app that collects what we need, excludes what we shouldn't, and gives users real control, not the illusion of it.
There's a moment in building any product where you realise you're flying blind. I am way more experienced in debugging web applications or data products. Apple apps, like iOS apps, are a completely different animal. Users report bugs you can't reproduce. Features you work on start behaving in weird ways on your users' machines. Performance is "fine" on your machine but apparently terrible on someone else's. You need data to understand what is going on and the lack of access to the log of events happening on the user's machine is annoying.
This is a dictation app. People speak their thoughts, emails, medical notes, legal briefs, love letters into it. The microphone is always one keystroke away. If we're going to collect telemetry, and we should, because we can't improve what we can't measure, we need to be ruthlessly deliberate about what we collect and what we don't.
This post is about what data we collect, what data we explicitly exclude, how users control it, and the architecture that keeps us honest.
TL;DR:
If you decide you do not want to go read all this (long and somehow technical post), here are the main lessons and takeaways:
Decide what you won't collect before deciding what you will. Our exclusion list (no text, no audio, no identifiers, no keys) was defined before we wrote a single line of telemetry code. The exclusion list is the contract with users. The collection list is flexible.
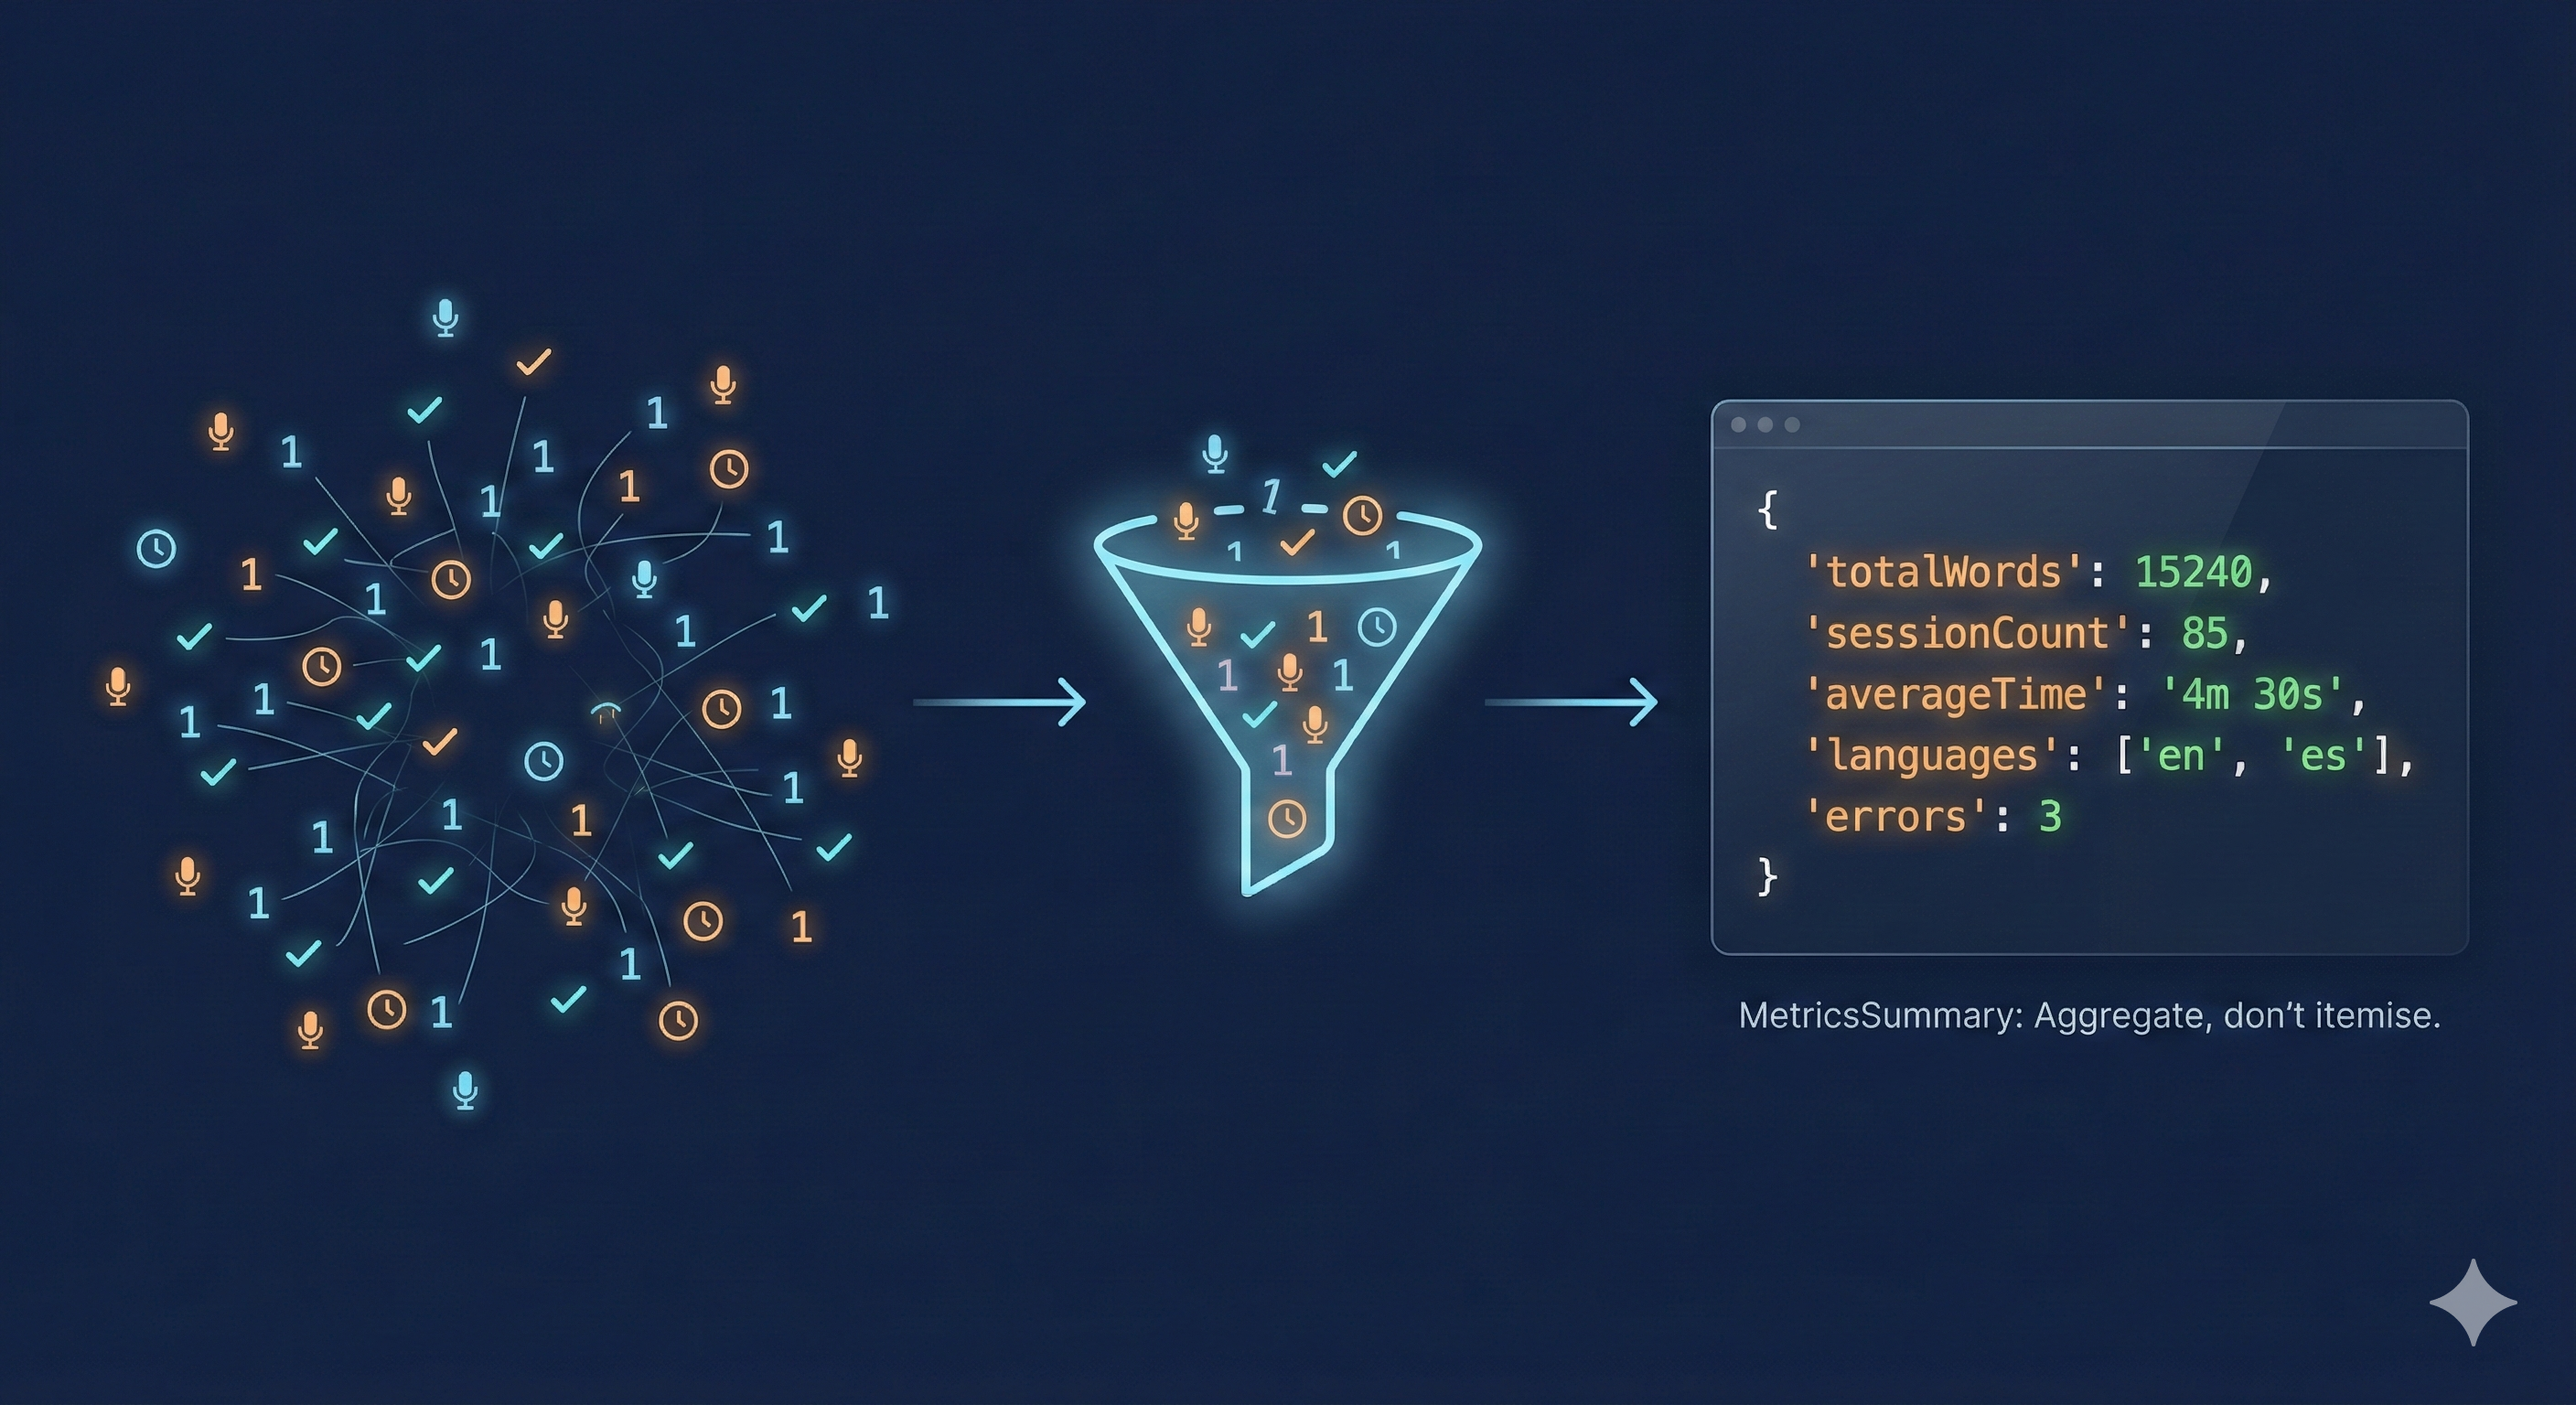
Aggregate, don't itemise. The MetricsSummary pattern, aggregating events into counts and averages before sending, is more useful than raw event streams for product decisions, and inherently more private. "3 dictation sessions, 450 words, English" is a product signal. A per-keystroke timeline is surveillance.
Make controls functional, not cosmetic. Export actually exports. Delete actually deletes. Disable actually stops collection. Users who exercise these controls should see them work, not wonder if something is still happening in the background.
Separate concerns. Telemetry, AI processing, network connectivity, and licensing are independent features with independent controls. Bundling them creates confusion. "Only Local" means local AI. "Telemetry Off" means no analytics. Users shouldn't need to understand our architecture to configure their privacy preferences.
Set data TTLs in infrastructure. Our 90-day KV expiration is a promise enforced by Cloudflare, not by our code. We can't accidentally retain data longer than 90 days even if we wanted to. Infrastructure-level privacy guarantees are stronger than policy-level ones.
The export test. Before shipping any telemetry change, we export our own data and read it. If we see anything we wouldn't be comfortable showing a user, we remove it. This is a simple test with a high bar: would you hand this JSON to the person it describes?
Building telemetry for a dictation app taught us that privacy isn't a feature you add. It's a constraint you design within. Every event type, every data field, every aggregation decision exists inside the boundary of "would we be comfortable explaining this to any user who asks?" If the answer is yes, ship it. If the answer is "well, technically...", cut it.
The Design Decision: Opt-Out, Not Opt-In
This is the first decision you have to make, and it's the most consequential. Do users start with telemetry enabled (opt-out) or disabled (opt-in)?
We chose opt-out. Telemetry is enabled by default on first launch. Users can disable it during onboarding or at any time in settings.
This was a deliberate trade-off. Opt-in systems typically see 2-10% participation rates. With a small user base, that means statistically meaningless data. You can't tell if a feature is unused because nobody wants it or because your 3% sample happened not to include anyone who uses it.
But opt-out carries some trade-offs: if you're going to collect data by default, the data you collect must be unimpeachable. No personal information. No content. No identifiers that could track a user across sessions. We are privacy focused first. The bar for what's acceptable goes up exactly because the user didn't explicitly agree to each data point.
During onboarding, alongside microphone and accessibility permissions, we present a telemetry card:
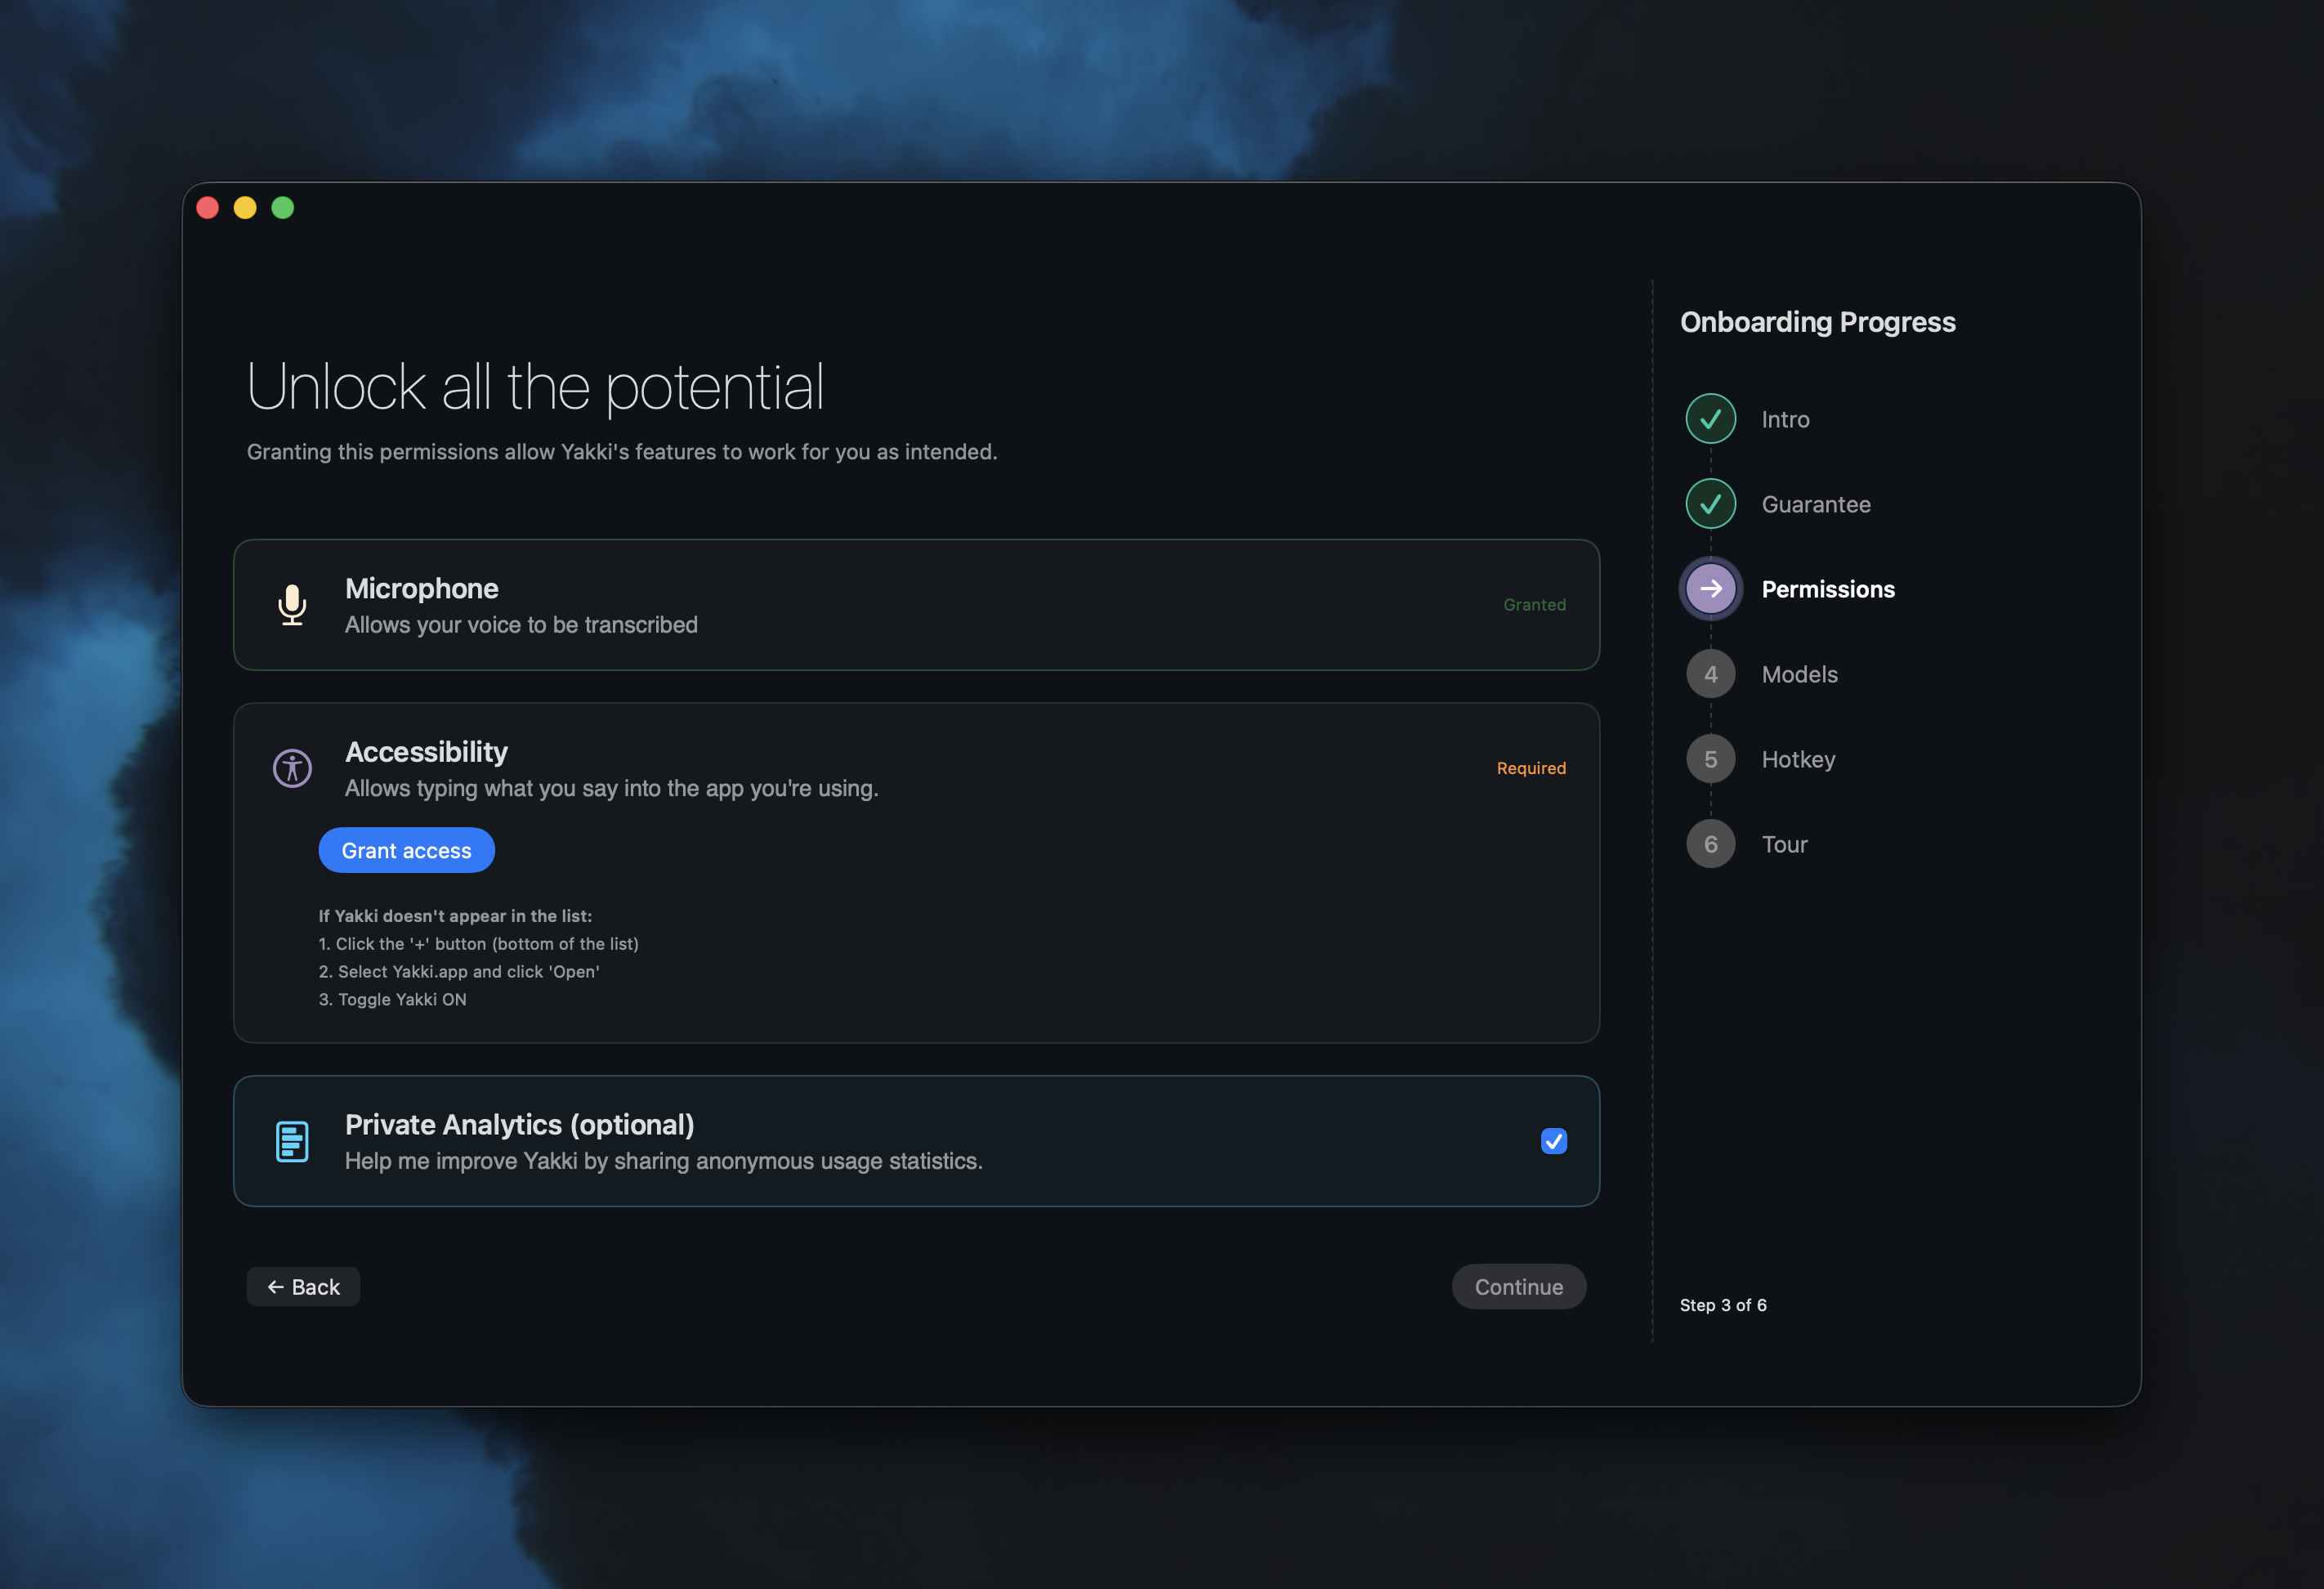
The card says: "Help me improve Yakki by sharing anonymous usage statistics." It's a toggle, not a checkbox buried in a Terms of Service. It's presented as optional, alongside the permissions that are required. The visual design is trying to communicate the difference, telemetry is the one you can say no to without breaking anything.
What We Collect (And What We Don't)
Every telemetry event is a TelemetryEvent struct:
struct TelemetryEvent: Codable {
    let id: String           // Random UUID (not user-linked)
    let timestamp: Date
    let eventType: TelemetryEventType
    let data: [String: AnyCodable]
    let sessionId: String    // Per-launch UUID (changes every restart)
    let appVersion: String
    let osVersion: String
}
Notice what's present: a random event ID, a per-session UUID (generated fresh on each app launch), the app version, and the macOS version. These tell us aggregate patterns without identifying individuals.
Notice what's absent: no user ID. No device ID. No hardware serial number. No IP address (from the client side). No Apple ID. No email. No license key value.
The sessionId is a UUID created at launch and discarded at termination. It lets us correlate events within a single session ("the user started dictation and then changed the language 30 seconds later") without linking sessions to each other. Tomorrow's session has a different UUID. We can't tell if today's user and tomorrow's user are the same person. That's the point.
What We Track
Our system has over twenty event types, organized into categories:
App lifecycle: launch, terminate, session start, session end. We know how often the app is opened and how long sessions last.
Feature usage: dictation mode changed, voice AI used, app audio used, feature enabled/disabled. We know which features people use, but not what they use them for.
Transcription metrics: started, completed, (number of) words transcribed. We know how many words were transcribed, not which words. The difference matters.
Model and language: language selected, model downloaded/used/deleted. We know that 20% of users use Spanish and 80% use the automatic detection (makes sense, as the initial groups of beta testers were mostly Spanish speakers).
Audio device: all related with the mic used, device changed, device error, Bluetooth warning shown/actioned. This is how we discovered that 15% of users had Bluetooth audio issues (we fixed that, but that is a story for another time).
Performance: performance metrics and error reports. Latency numbers, crash categories, initialisation times. I was very concerned about not having any visibility of user's issues.
License lifecycle (15 events): trial started/expired/converted, license activated/validated, feature blocked, purchase URL opened. This is the business-critical data, I am trying to understand the trial-to-purchase funnel (now my second focus after improving the product).
What We Explicitly Exclude
This list is more important than the previous one:
- No transcribed text. Ever. Not a single word the user dictated leaves the device through telemetry. We count words. We don't read them.
- No audio content. No recordings, no audio samples, no voice fingerprints.
- No file paths. If a user is dictating into a file called "legal-case-johnson-v-smith.docx," we don't know about it.
- No license keys. When logging license events, we record
has_key: trueandkey_length: 12, never the key itself. - No persistent identifiers. No way to correlate data across sessions or link telemetry to a specific person.
- No screen content. We don't capture what app the user is typing into, what window is focused, or what text surrounds the cursor.
The license key exclusion deserves some explanation. Our license events track the purchase funnel in detail: activation attempts, successes, failures, error codes. But the actual key never appears in telemetry. We log if you have a key when using yakki, never the key. Enough to debug "user says they entered a key but activation failed" without ever seeing the key.
The Dual-Layer Architecture
We actually have two telemetry systems. They serve different purposes and have different privacy profiles.
Layer 1: TelemetryManager (Network, Product Analytics)
TelemetryManager is the system described above. It collects product analytics events, batches them, and sends them to a Cloudflare Worker. This is the data that drives product decisions: which features are used, where users drop off, what errors occur most frequently.
Events accumulate in memory and flush under two conditions, batch size and time interval.
private let batchSize = 50
private let batchTimeout: TimeInterval = 300 // 5 minutes
When 50 events accumulate or 5 minutes elapse, whichever comes first, the batch is sent. On app termination, any remaining events are flushed immediately.
Before sending, events are aggregated into a MetricsSummary:
struct MetricsSummary: Codable {
    let totalWordsTranscribed: Int
    let dictationSessions: Int
    let voiceAISessions: Int
    let appAudioSessions: Int
    let languagesUsed: [String]
    let modelsUsed: [String]
    let voiceAIProviders: [String]
    let appAudioApps: [String]
    let averageTranscriptionTime: Double?
    let errors: Int
}
The summary is an aggregation, not raw data. We see "this session had 3 dictation sessions totaling 450 words in English using Parakeet v3," not a per-keystroke timeline. This is deliberate. Aggregate data is useful for product decisions and useless for surveillance.
Layer 2: TelemetryLogger (Local Disk, Developer Diagnostics)
TelemetryLogger is completely separate. It writes structured logs to disk at ~/Library/Logs/ainokoe/. It never touches the network. Its purpose is developer diagnostics: performance metrics, buffer health, audio system state.
[2026-02-19T03:14:22Z] performance cpu_percent=12.3 memory_mb=245
    buffer_utilization=0.67 transcription_latency_ms=89
[2026-02-19T03:14:23Z] health_issue severity=warning
    issue=high_buffer_utilization details=peak_0.92
Logs are automatically cleaned after 7 days. The file header states: "No user data or transcription content is logged."
The separation matters. Network telemetry is minimal, aggregated, and user-controllable. Local logging is detailed, ephemeral, and never leaves the machine. Both exist because they serve different needs. Combining them would mean either sending too much data to the server or not having enough data locally for debugging.
User Controls: Export, Delete, and Disable
The settings UI gives users three actions:
Disable telemetry. A toggle that immediately stops all event collection. When disabled:
func disableTelemetry() {
    isEnabled = false
    isOptedIn = false
    UserDefaults.standard.set(false, forKey: "telemetryEnabled")
    UserDefaults.standard.set(false, forKey: "telemetryOptedIn")
    clearAllData()  // Wipe all in-memory events
}
Both isEnabled and isOptedIn must be true for any event to be recorded. Every event passes through a gate:
func logEvent(_ eventType: TelemetryEventType, data: [String: Any] = [:]) {
    guard isEnabled && isOptedIn else { return }
    // ...
}
When telemetry is off, nothing is collected. Not reduced, not anonymized, not collected at all.
Export data. Users can export all current in-memory telemetry as a JSON file. They can see exactly what we've collected. This is transparency as a feature: if a user is curious about what "anonymous usage statistics" actually means, they can look.
Delete data. A destructive action with a confirmation dialog that wipes all in-memory telemetry events. The button is red. The confirmation says "This action cannot be undone."
These aren't decorative. They're functional. A user who exports their data will see JSON containing event types, timestamps, word counts, and model names. They will not find their dictated text, their email content, or anything personally identifiable. That's the test: would we be comfortable if every user exported their data and posted it publicly?
The Server Side: Cloudflare Workers and KV
Telemetry data is sent to a Cloudflare Worker that stores it in Cloudflare KV (key-value storage). The architecture is deliberately simple:
Client (macOS)  -->  Cloudflare Worker  -->  KV Storage
                         |
                         v
                    Aggregation
Each batch is stored with a key pattern of telemetry:{sessionId}:{timestamp} and a TTL of 90 days:
await env.TELEMETRY_KV.put(key, JSON.stringify(metrics), {
    expirationTtl: 60 * 60 * 24 * 90  // 90 days
});
After 90 days, the raw data automatically expires. We don't delete it. It deletes itself. This is a privacy guarantee embedded in the infrastructure. Even if we wanted to keep data longer, the storage mechanism won't let us.
The worker performs server-side aggregation on each submission, updating running totals in a summary key. This gives us trend data (are total words transcribed going up? are error rates going down?) without needing to retain individual session data.
Weekly snapshots are stored for trend analysis. These let us compare week over week: did the latest release improve or degrade the error rate? Are more users trying voice AI this week? The snapshots contain aggregate counts, not individual events.
What We Actually Learn
Here's what our analytics dashboard tells us:
Feature adoption. We can see that dictation is the primary use case, AI assisted features are growing, and app audio capture is niche but passionate. This guides development priorities.
The trial-to-purchase funnel. We track: trial started -> trial milestone. We can see where users drop off. We discovered that users who hit the 80% trial milestone convert at 3x the rate of users who don't.
Error patterns. We see that 15% of users encounter Bluetooth audio warnings, that initialisation times out on machines running concurrent video calls, and that a specific macOS version has a higher rate of accessibility permission issues. That has enabled fixing all those issues.
Performance baselines. Average transcription latency across all users, model initialisation times by hardware class, audio buffer health metrics.
What we don't learn: anything about the user as a person. We don't know their name, location, employer, what they're writing, or why. We know that "a session used dictation for 200 words in English with model X and had 89ms average latency." That's a product signal, not a profile, we want to improve the service, not peek on our users.
The "Only Local" Mode Question
Yakki has an "Only Local" mode that disables all cloud AI features: LLM-based formatting, cloud transcription fallbacks, and the AI proxy. A natural question: does "Only Local" disable telemetry too?
No. And this was a conscious decision.
"Only Local" is about AI processing, ensuring your transcription happens on-device. It's not a network kill switch. Telemetry has its own control: the toggle in settings. These are orthogonal concerns. A user might want local-only AI processing but still be happy to share anonymous usage statistics. Another might want cloud AI but not telemetry. Both configurations are valid.
Having "Only Local" disable telemetry as a side effect would be confusing. Users who enable "Only Local" for AI privacy might not realize they're also disabling the analytics that help us fix bugs. And users who disable "Only Local" might not realize they're re-enabling telemetry they previously turned off. Separate controls for separate concerns.
Building the Analytics Pipeline
The raw telemetry data feeds into two analysis tools: an automated weekly comparison and a manual deep-dive script.
The weekly comparison runs automatically and produces a report:
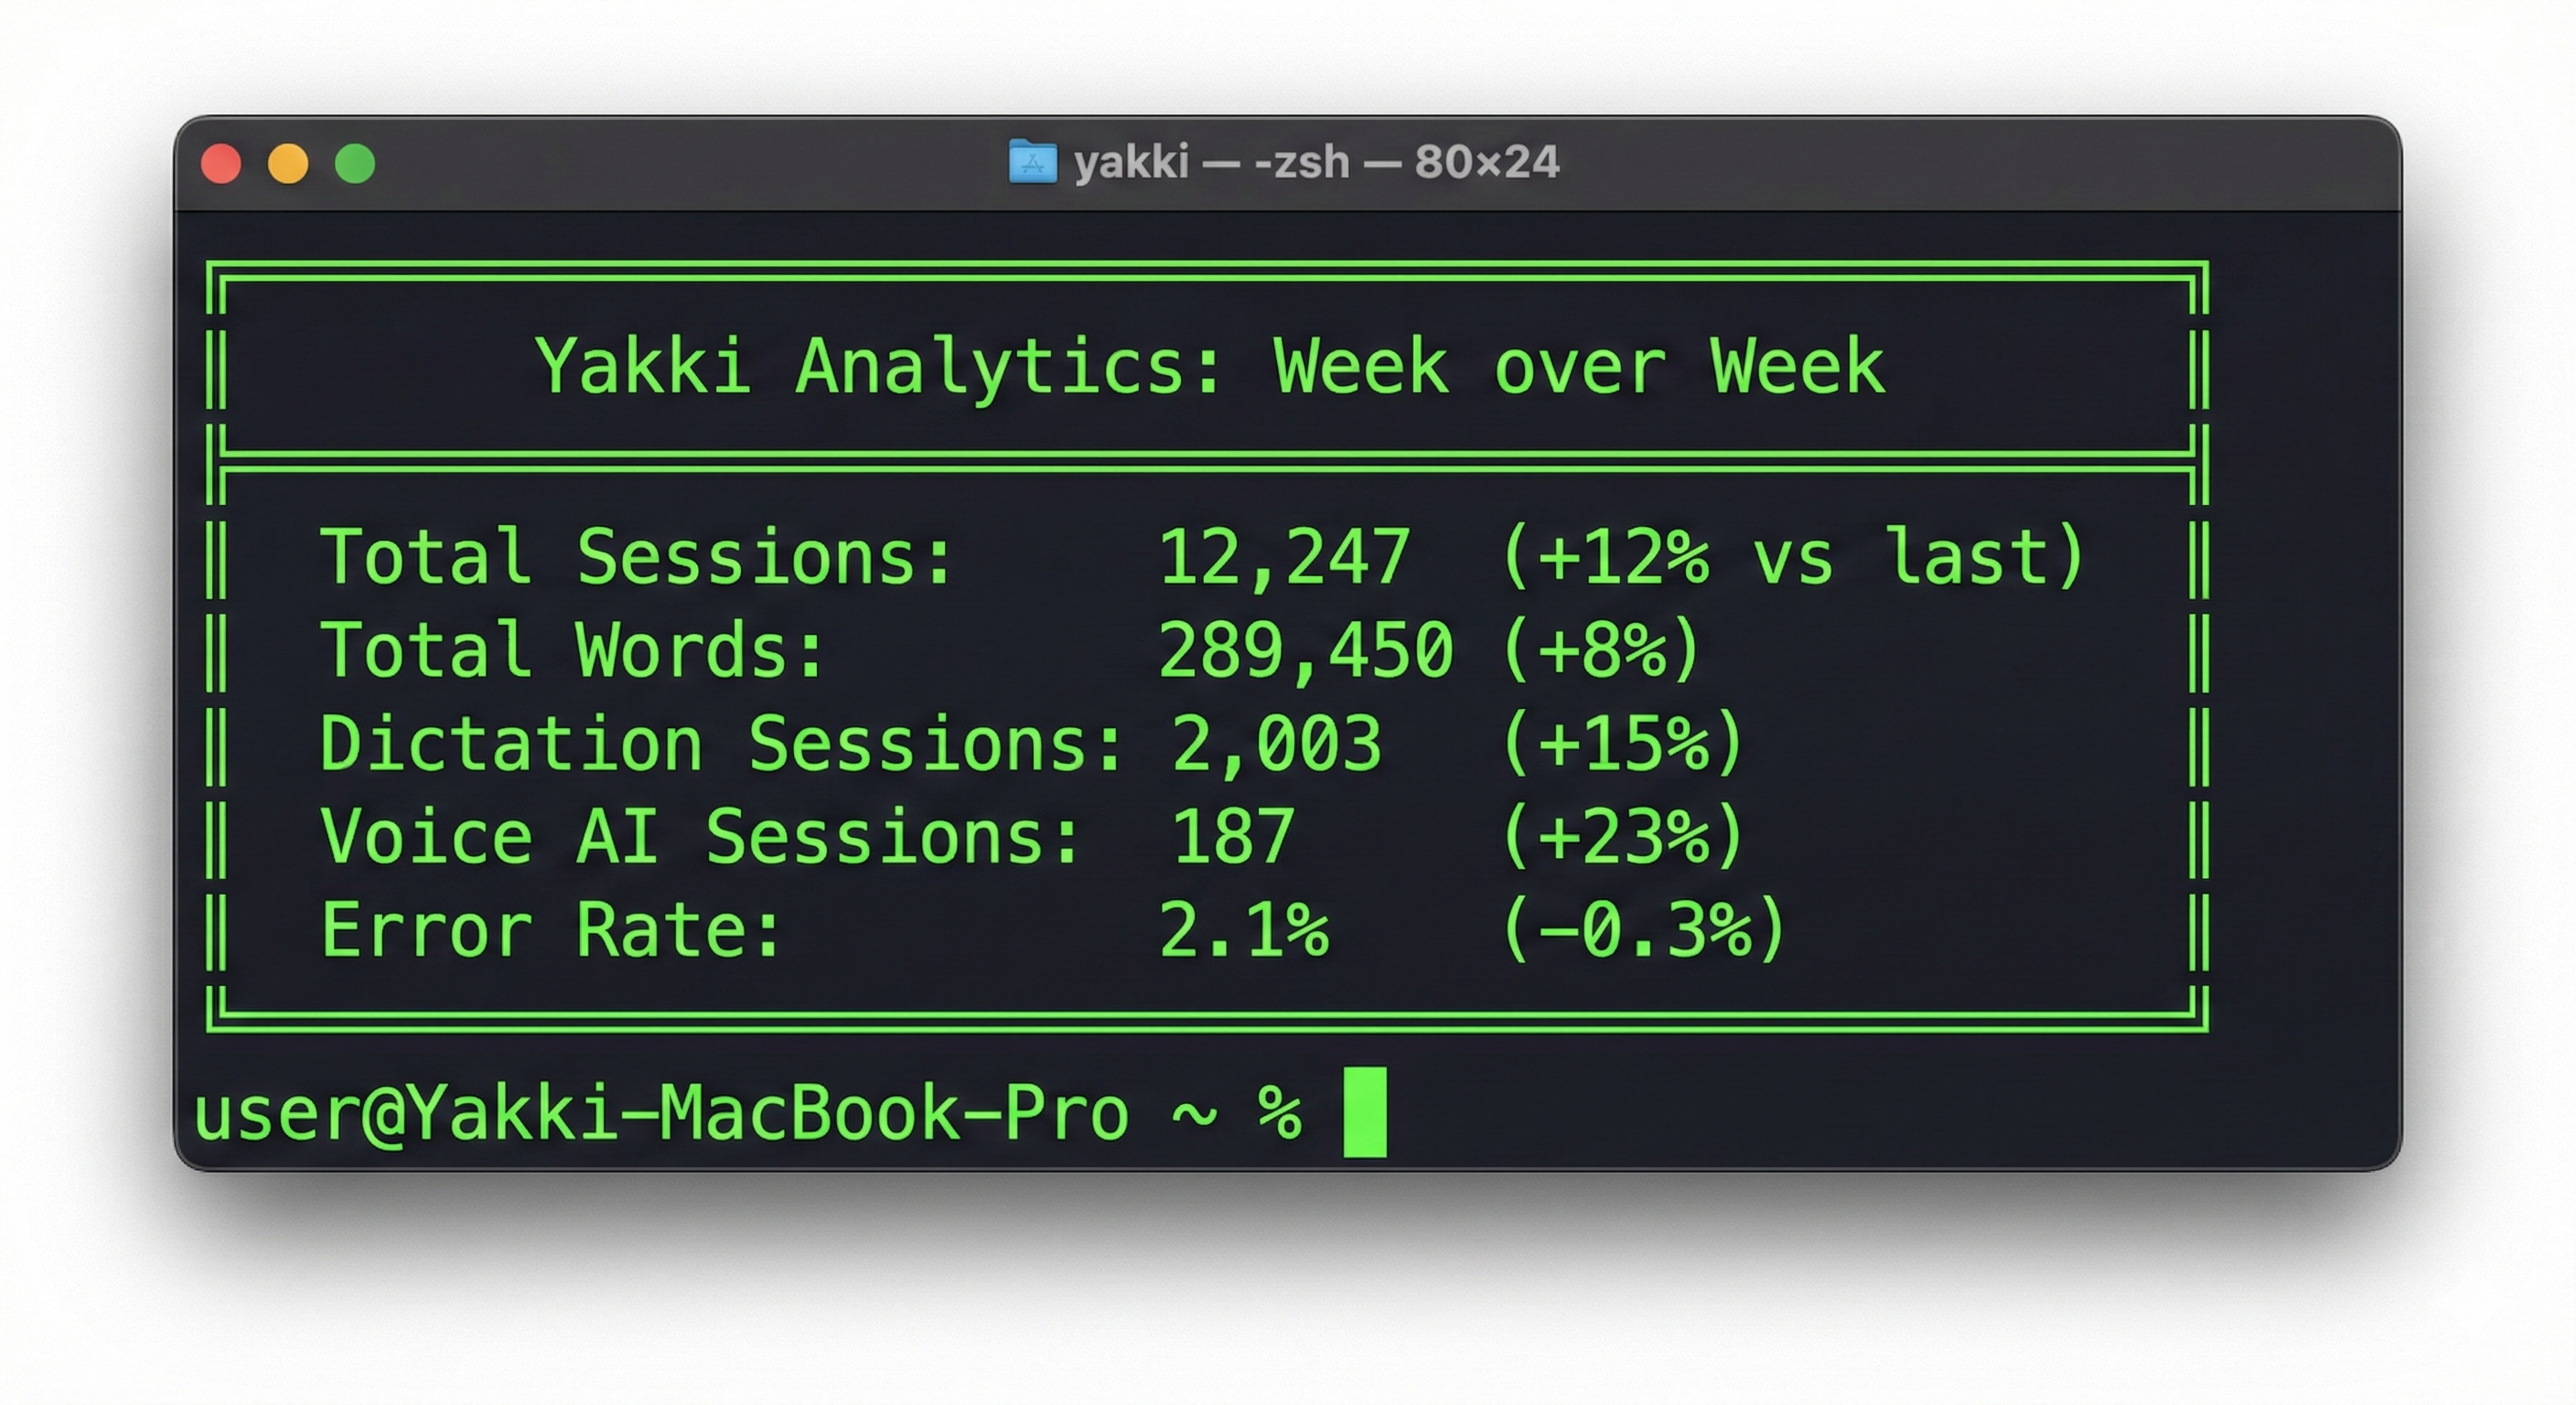
We also calculate a "Time Saved" metric: comparing the word count against average typing speed (40 WPM) versus dictation speed (150 WPM). The delta is the time our users saved by speaking instead of typing. It's a vanity metric, but it's motivating, and it's derived entirely from aggregate word counts, not individual sessions.
The onboarding analytics script is more detailed. It analyzes the onboarding funnel step by step:
- What percentage of users complete each onboarding step?
- Where do users drop off?
- What permissions do users decline?
- Do users customize their hotkey or accept the default?
- Do users complete the practice exercise or skip it?
This data directly shaped our onboarding redesign. We discovered that the model download step had a 30% drop-off rate: users were closing the app during the download. The fix: show download progress and let users continue onboarding while the model downloads in the background. The friction flag, any step with under 70% completion, automatically surfaces in the analysis output.
Yakki is a macOS dictation app that respects your privacy by design. Transcription happens on-device, telemetry is anonymous and optional, and you can export or delete your data at any time. Learn more at yakki.ai.